
How Reliable Is Your Node?
How to measure RPC provider performance using production request data
RPC providers are the infrastructure layer that all blockchain applications depend on. Yet no standardized framework exists for quantifying their performance or reliability. This creates significant risk for applications that cannot tolerate data loss or service degradation.
This article presents a data-driven analysis of RPC provider performance across the EVM ecosystem, derived from over 1.5 billion requests processed between August and October 2024. The analysis covers success rates across chains, providers, and methods — with granular breakdowns that reveal patterns invisible to the end user.
The findings are structured around four dimensions that determine node performance: chain characteristics, provider infrastructure, RPC method complexity, and temporal variance.
How Nodes Work
Before analyzing performance data, it is important to understand the structure of the node industry. At a high level, full or archive nodes are run on specific client implementations (geth, reth, erigon for Ethereum), each with varying configuration profiles. These nodes are hosted by providers who make them accessible via JSON-RPC interfaces.
The reliability of any single RPC call depends on the interaction of multiple factors. A failure is not simply "the node is down" — it can result from chain-specific consensus issues, provider-side infrastructure problems, client implementation bugs, or method-specific resource constraints.
Optimal Node Selection
Understanding node performance requires decomposing the RPC request pipeline into its constituent dimensions. Four primary factors determine whether a request succeeds:
1. **The chain being queried** — each chain's network of nodes behaves differently, with varying activity levels, consensus finality times, and infrastructure maturity.
2. **The method being called** — full node calls (latest blocks) behave very differently from archive calls (historical state), and the client implementation impacts performance.
3. **The provider being used** — the entity hosting the nodes influences reliability through infrastructure quality, geographic distribution, and operational practices.
4. **The timing of the request** — node performance varies over time and is not constant. Networks experience congestion, providers undergo maintenance, and blockchain protocols have upgrade cycles.
These dimensions interact in complex ways. A provider that performs well on one chain may perform poorly on another. A method that succeeds consistently for one provider may fail frequently for another.
The Data
The analysis below is based on production request data with the following scope:
- **Date range:** 1 August 2024 — 20 October 2024
- **Total requests:** 1,492,103,937
- **Successful responses:** 1,171,952,063
- **Failed responses:** 320,793,140
- **Average success rate:** 78.5%
A 78.5% average success rate across nearly 1.5 billion requests reveals significant variation. The remainder of this article breaks down that variation across each dimension.
Chain Performance
Chain performance varies significantly. This chart shows the average daily success rate across all providers and methods for each chain:
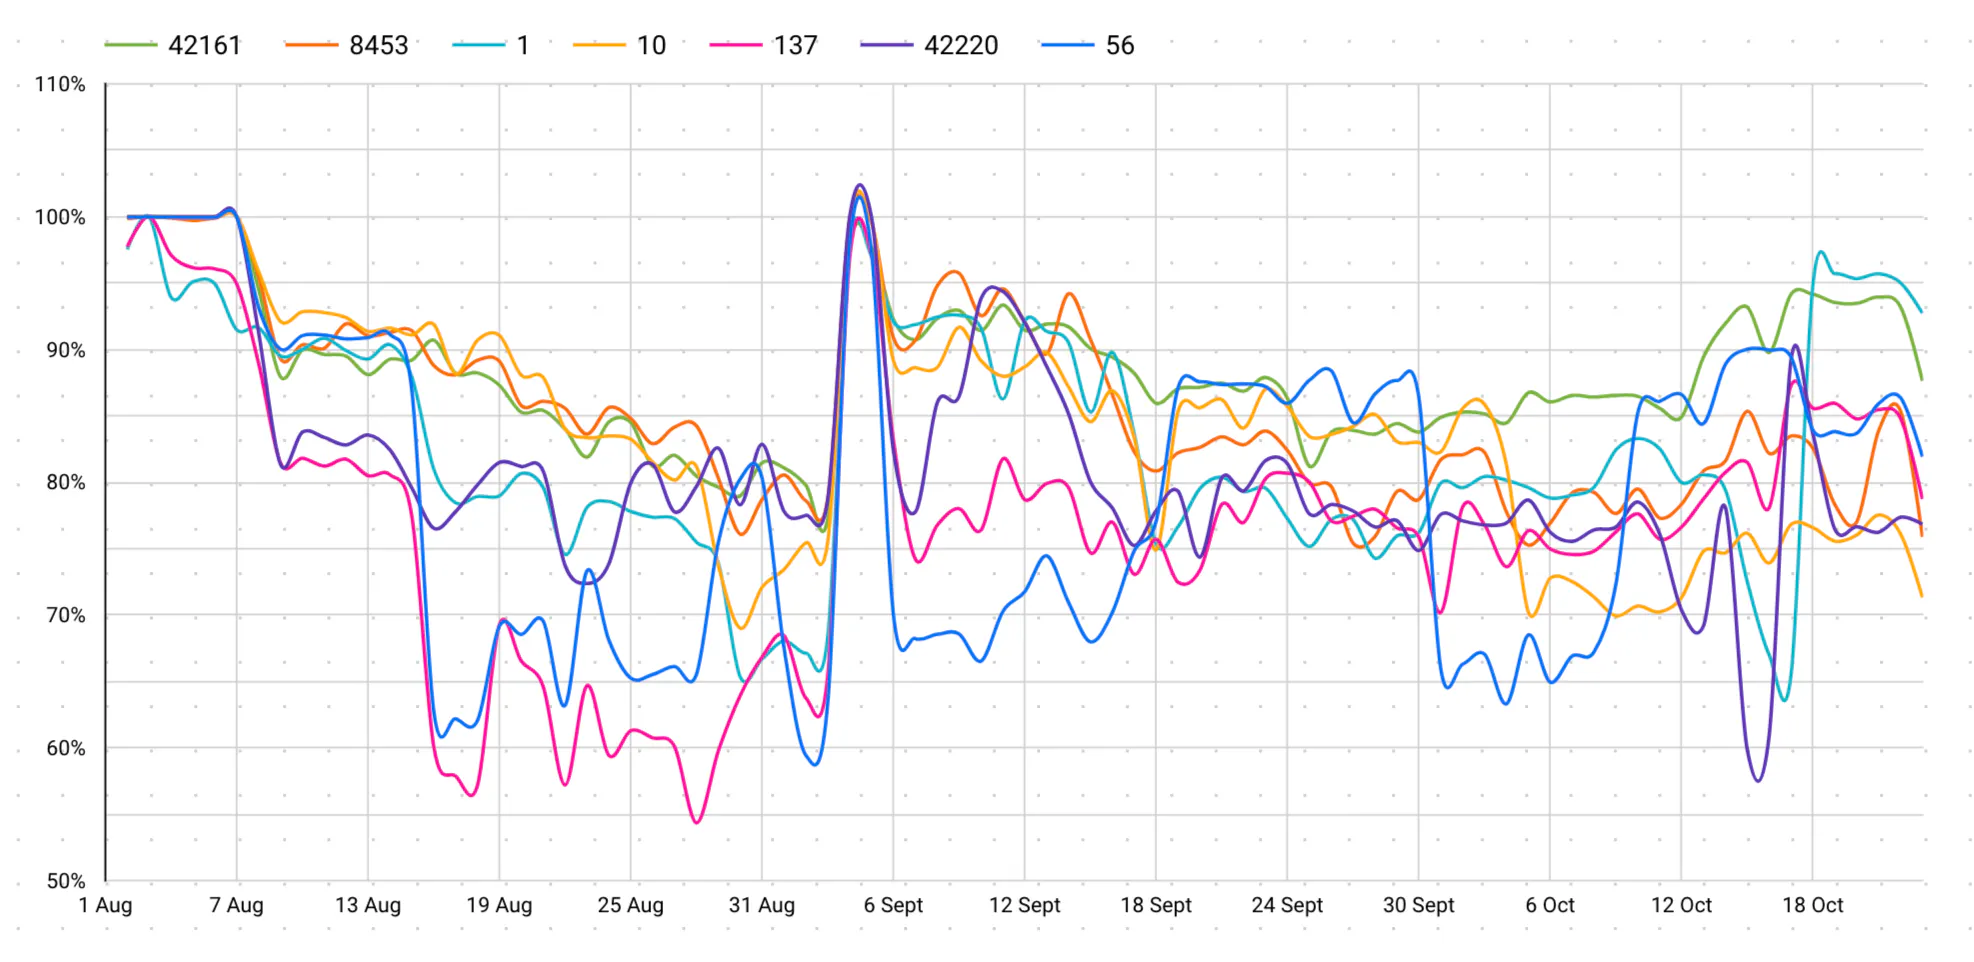
A critical caveat: low success rate on a given chain does not necessarily indicate a problem with the chain itself. It may reflect the chain's internal architecture, block production patterns, or the difficulty of certain methods on that chain. The value of this data is in comparing chains relative to each other and identifying temporal patterns.
This chart shows the same chain performance data over a 17-day period, filtered to a single provider. The graph is significantly smoother, confirming that provider-level variance is masked when aggregating across providers:
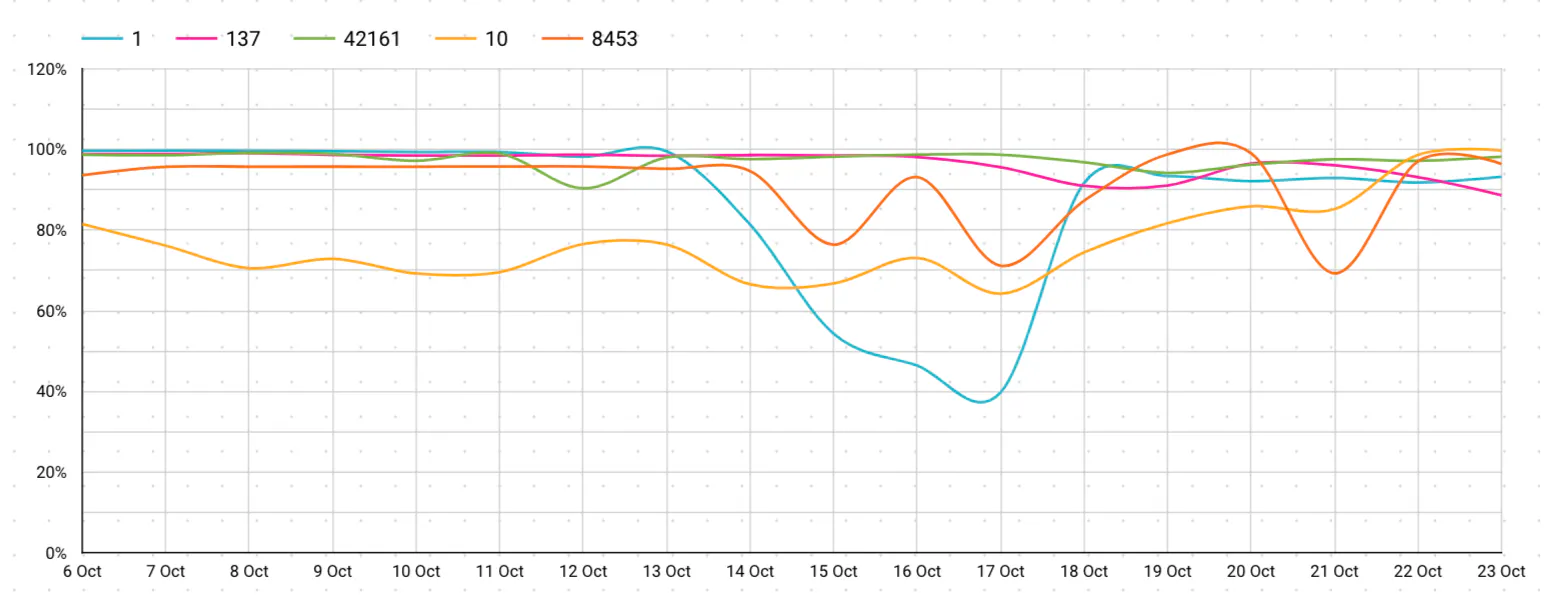
This demonstrates why analyzing at the provider level is necessary — a provider that appears good in aggregate may be failing on specific chains.
Provider Performance
This chart simplifies the data by plotting the average success rate over time for several major RPC providers:
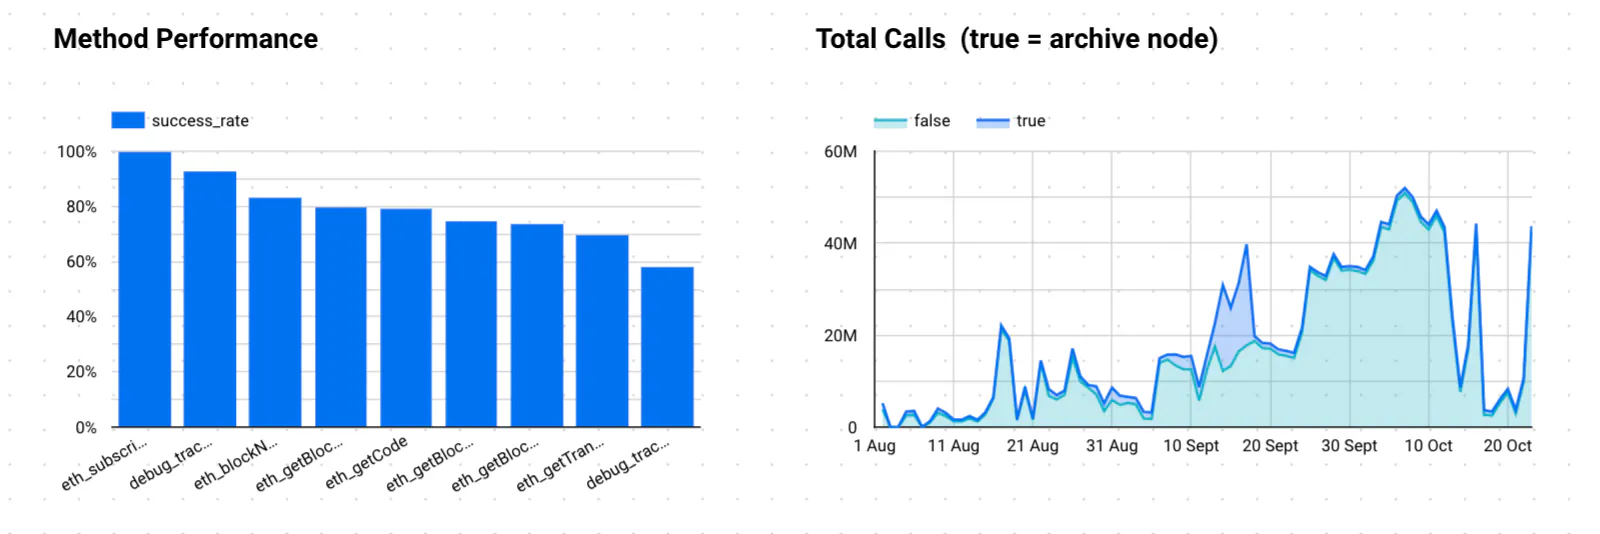
The chart may suggest choosing the best-performing provider, but this oversimplifies the problem. Provider performance varies by chain and method. A provider with high average success may fail on the specific chains or methods your application depends on.
This is where the chain-level analysis becomes essential. If you need reliable access to Polygon, a provider's overall 95% success rate is less relevant than their Polygon-specific success rate.
Method Performance
Success rates vary considerably across different RPC methods. This chart shows how success changes month-to-month for various methods:
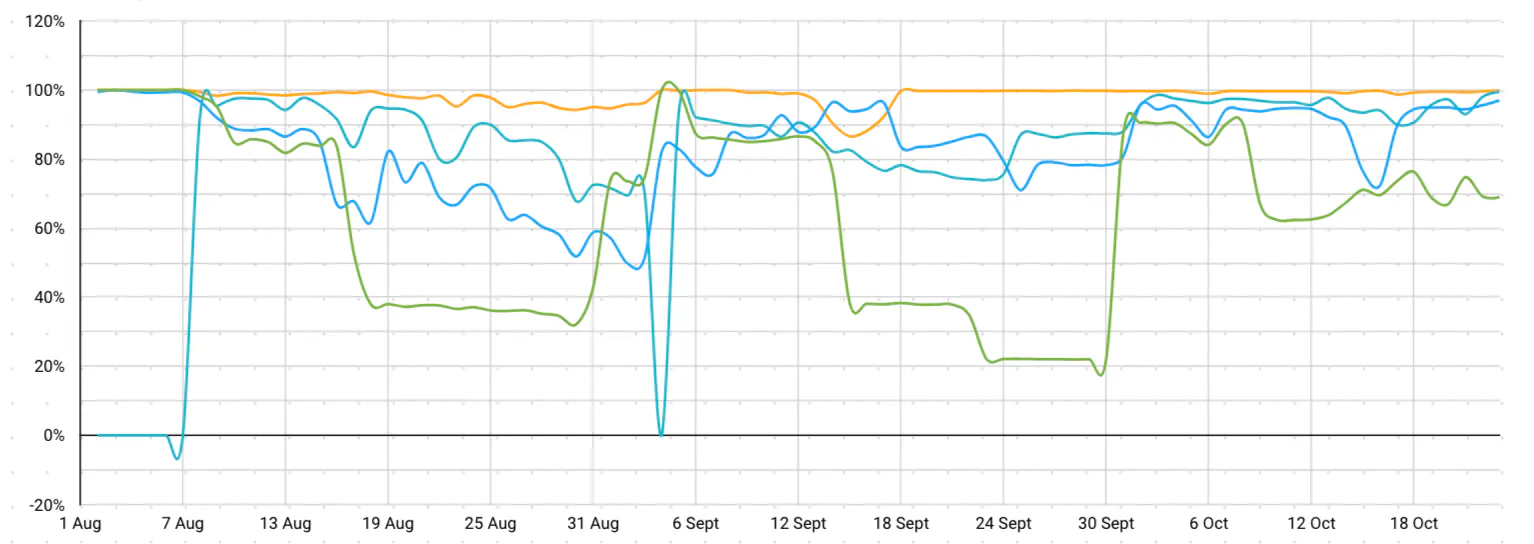
Averaging the data produces this breakdown of average success rate per method, with the shaded areas indicating variance:
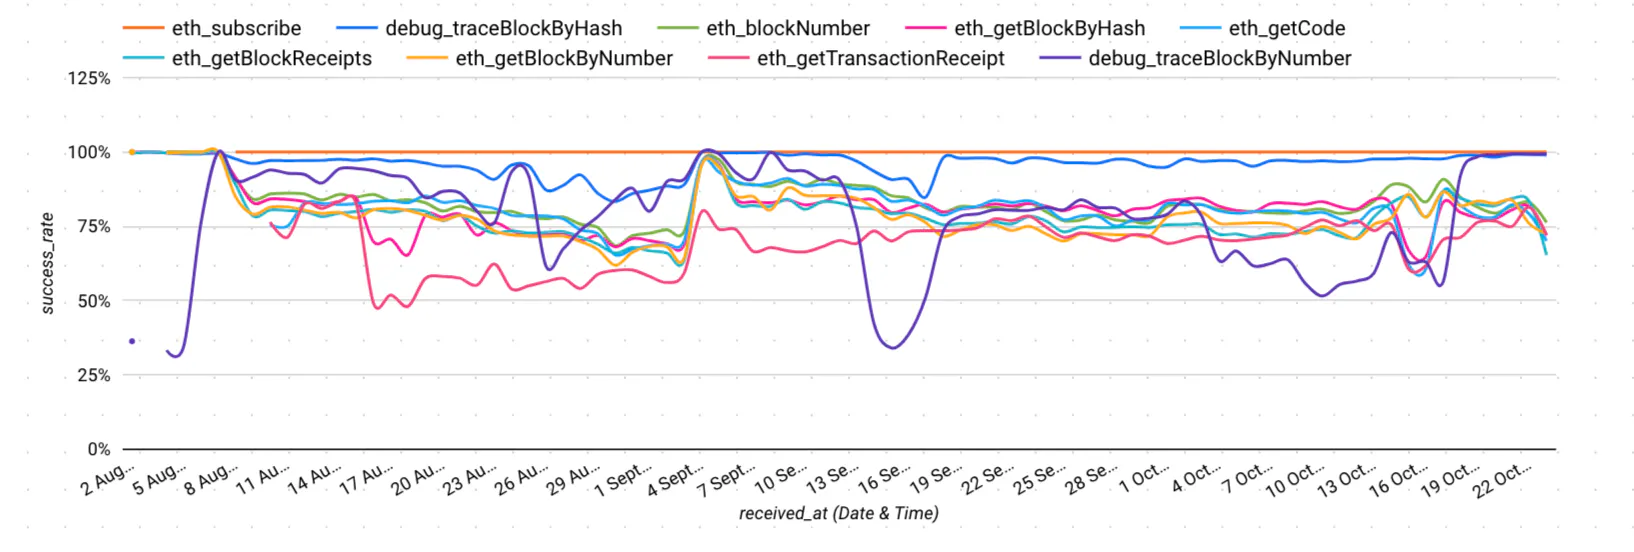
Archive methods consistently show lower success rates than calls to the latest block. This reflects the computational complexity of serving historical state. Methods like `eth_getLogs` and `eth_getBalance` with block ranges impose significant load on node infrastructure.
The method-level analysis reveals that your application's most critical methods may have significantly different reliability profiles than the average.
Provider Method Performance
To make matters more complicated, each provider has its own method-level performance profile. The chart below shows provider success rates across different methods:
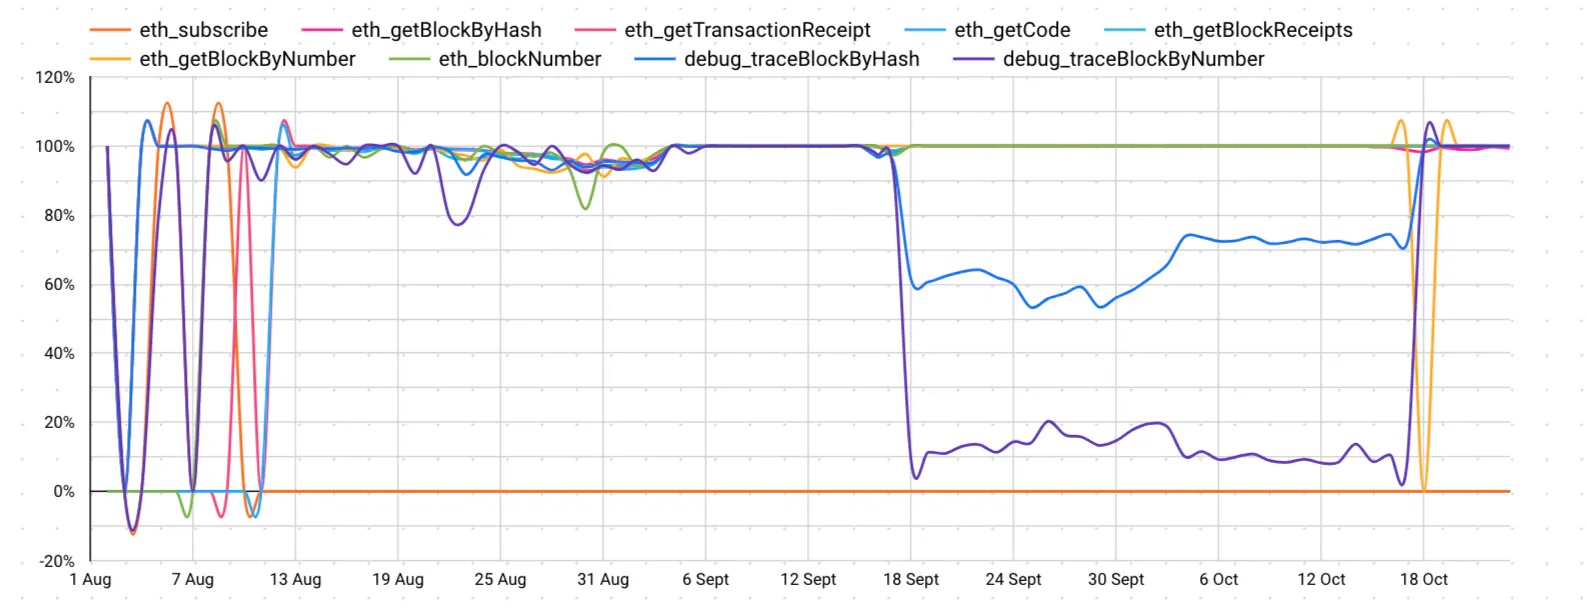
No single provider dominates across all methods. A provider excelling at `eth_getBlockByNumber` may underperform on `eth_getLogs`. This makes blanket provider selection strategies unreliable.
Optimal Strategy
The data presents a clear conclusion: there is no single optimal node. The most reliable approach depends on your application's specific requirements.
One approach is to use multiple fallback providers. However, fallback providers require manual configuration, do not scale well across chains, and introduce their own complexity.
The alternative is to use a routing system that evaluates node performance in real-time, selecting the best available provider for each request based on the chain, method, and historical performance data.
Pricing Complexity
Adding another layer of complexity, pricing for every provider varies by chain and method. These differences are not trivial:
- Chain pricing differs based on infrastructure costs
- Method pricing differs based on computational requirements
- Volume discounts vary by provider
- Some providers charge differently for archive vs. full node access
The optimal strategy balances cost against reliability. A 2% improvement in success rate may justify a 20% increase in cost if the alternative is data loss or application downtime.
Conclusion
If you're managing RPC infrastructure or evaluating providers, the data above should reshape how you think about node reliability. There is no single "best" provider. There is only the best provider for your specific chain, method, and reliability requirements.
The most effective approach is to measure continuously, route intelligently, and never assume a provider's overall success rate applies to your specific use case.